Prediction of Fullness of cDNA Fragment sequences by combining Statistical Information and Similarity with Protein Sequences
*Tetsuo Nishikawa,1,2 Toshio Ota,1,3 and Takao Isogai1
Running head: Prediction of Fullness of cDNA Sequences
Keywords: Prediction, Full length cDNA, Similarity, translation initiation codon
1. Helix Research Institute, Chiba, Japan
2. Present address: Biosystem Research Department, Hitachi, Ltd., Central Research Laboratory
1-280 Higashi-Koigakubo, Kokubunji-shi, Tokyo, 185-8601, Japan
3. Present address: Kyowa Hakko Kogyo Co., Ltd., Tokyo Research Laboratories
3-6-6 Asahi-machi, Machida-shi, Tokyo, 194-8533, Japan
*To whom correspondence should be addressed
Abstract
Motivation: We already developed a computer program, ATGpr, for effectivily predicting translation initiation codons in cDNA sequences. While statistical information contained in cDNA sequences is used in ATGpr, similarity information of these sequences with those of known proteins is an important source for predicting the initiation codons because a number of new protein sequences are being determined by genome sequencing projects. Here we present a new approach, which uses both statistical and similarity information with known proteins, for predicting the fullness of a cDNA sequence, i.e. for predicting whether a cDNA sequence contains an initiation codon in it.
Results: We evaluated the accuracy of ATGpr for predicting fullness of cDNA sequences from human clustered ESTs of UniGene, and we obtained specificity and sensitivity of this prediction. We found that the specificity and the sensitivity crossed at 46% at a ATGpr score threshold of 0.33. We also found that it is effective to use alignments with known proteins for predicting the fullness of cDNA sequences. The specificity predicted as positive increased monotonously as identity of the alignments increased and is greater than 80% at identities greater than 40%. For effective prediction of fullness of cDNA sequences we combined the similarity with known proteins and ATGpr score. At any identity region greater than 20%, specificity of positive prediction became greater than 80% by combining ATGpr score condition with identity condition at each identity region.
Availability: The prediction program, called ATGpr_sim, is available at http://www.hri.co.jp/atgpr/ATGpr_sim.html
Contact: nisikawa@crl.hitachi.co.jp
Introduction
More than one million human cDNA fragment sequences have already been published by ESTs projects [Hillier, L.,1996]. The ESTs sequences are often incomplete in the 5'-region of full length cDNA sequences. However, for a functional analysis of gene, it is important to obtain the clones including the intact protein coding sequences (complete clones). To obtain complete clones efficiently, it is necessary to develop computer programs which select them efficiently from given cDNA fragments as well as to develop effective methods for generating complete clones [Maruyama, K. and Sugano, S., 1994]. We therefore previously developed a computer program, ATGpr [Salamov, A. A., et al., 1998], which estimates the reliability of the prediction by using statistical informations; in the prediction each ATG in a given DNA sequence is predicted as a true translation initiation codon or not in a given DNA sequence. By using complete cDNA sequences, we evaluated the accuracy of the initiation codon prediction by ATGpr in that study.
In practice, however, it is also important to know whether a fragment sequence of cDNA, such as an EST, contains a translation initiation codon or not (complete or not). The prediction of the initiation codon is difficult in principle because of many false ATG codons contained in a cDNA sequence. Since ATGpr uses only statistical information derived from the cDNA sequences, the accuracy can be expected to improve when information on similarity with other known proteins and statistical information are used. Moreover, lots of newly determined protein sequences from genome sequencing projects (microbial genome projects are listed at TIGR homepage, http://www.tigr.org/ ) can be used for the prediction.
We have developed a new prediction method, which uses both statistical and similarity information to obtain higher accuracy of fullness prediction for fragment sequences of cDNA clones. We used human UniGene data [Schuler, G. D., 1997] as a source of cDNA fragment sequences. First, we evaluated the prediction accuracy of ATGpr for fragment sequences in UniGene. Second, we evaluated the prediction accuracy for fragment sequences when alignment information with known proteins was used. Third, we investigated how to combine the ATGpr score with the alignment information for efficient prediction of fragment sequences, and we evaluated the accuracy of the prediction using UniGene.
Method
Prediction of fullness of cDNA by ATGpr and its evaluation using UniGene
As shown in Fig. 1. 5,732 clusters (Full UniGene clusters), which are made by removing incomplete clusters with no mRNAs with translation initiation codons from known human UniGene clusters (Build49, 6,963 clusters; "known" means that they include mRNA sequences), were used. A representative mRNA (longest mRNA in a cluster) and 5'-ESTs are extracted from each full UniGene cluster. The 5'-ESTs are compared with the representative mRNA by using BLASTN (BLAST2.0), and the 5'-ESTs satisfying matching conditions (alignment length>=200 bases; identity>=90%) are selected (4,421 clusters). A 5'-EST is randomly sampled from each cluster (representative 5'-EST). Whether representative 5'-EST includes the initiation codon is judged by using the alignment with the representative mRNA sequence. The maximum ATGpr score in all ATGs included in each representative 5'-EST (we call this value the ATGpr score) is then calculated. When the ATGpr score is greater than a given threshold, the cDNA sequence is predicted as "full"; that is, it includes an initiation codon.
Prediction of fullness of cDNA by using ATGpr score and similarity with other proteins
It has been empirically observed that N-terminals of similar sequence- proteins close to each other. Figure 2 compares ANFB_HUMAN BRAIN NATRIURETIC PEPTIDE PRECURSOR (BNP) with OWL protein sequences, and several alignments are obtained. There are three homologous protein sequences to the query in the hit list. Their initiation codons are aligned at the same position. It is therefore expected that fullness can be predicted by aligning unknown cDNA fragments with known proteins (fullness means that they includes an initiation codon). We call this "prediction by similarity." We therefore developed the following prediction method. An unknown cDNA sequence is aligned with known proteins by BLASTX as shown in Fig. 3. When the alignment satisfies a certain condition and the not-aligned region of the 5'-terminal of the cDNA is longer than that of proteins multiplied by three, the cDNA sequence is predicted as "full"; that is, it includes an initiation codon. The alignment conditions are identity, consensus length, and E-value. We evaluated this method by answering the following questions:
- What is the optimal alignment condition?
- What is the accuracy of the prediction under the optimal alignment condition?
- What is the optimal combination of prediction by using alignment with that by using ATGpr?
A representative mRNA and hit 5'-ESTs are extracted and selected from each full UniGene cluster (Fig.1) as shown in (Fig.4). Whether the representative 5'-EST randomly sampled from each cluster includes the initiation codon is checked by using the alignment with the representative mRNA sequence. The representative 5'-EST is compared with protein sequences in the full-OWL protein database (152,308 entries); that is, the full-OWL protein database is a protein database made by removing fragment sequences and sequences with no methionin at N-terminal from the OWL protein database. For evaluating the accuracy of the prediction by similarity, the alignment parameter, in this case the identity (we call this prediction space), is divided into regions. Then fullness prediction by similarity is performed and its accuracy in each identity region is evaluated. If we evaluate the accuracy of the prediction in the region where the identity is greater than a threshold (as we did in the ATGpr evaluation), the accuracy obtained is significantly affected by the similarity distribution. Because known cDNA sequences usually have more similar proteins than unknown cDNA sequences (unpublished data), the accuracy of the prediction by similarity of unknown cDNA sequences may be lower than that of known cDNA sequences. To avoid this difference, we evaluate the prediction by similarity in each identity region. For evaluating the accuracy of the prediction by similarity and ATGpr, the prediction space, which consists of identity and ATGpr score, is divided into many local regions. Then fullness prediction by similarity and ATGpr in each region is performed and its accuracy is evaluated. This evaluation method is therefore independent of similarity distribution.
Results
Prediction of fullness of cDNA by ATGpr
The specificity and the sensitivity of the prediction by using ATGpr are plotted against the threshold from 0 to 1 as shown in Fig. 5. The specificity and the sensitivity are defined as follows.
 - - - - - - - - -(1)
 - - - - - - - - -(2)
In the figure, specificity increases from 19% (threshold: 0) to 100% (threshold: 1). And sensitivity decreases from 100% (threshold: 1) to 0(threshold: 1). Specificity and sensitivity cross at 46% and at a threshold of 0.33. Though 46% is not so high, it is much larger than 19% (at threshold: 0), which is the fullness-rate of UniGene. At a threshold of 0.8, specificity is 80%, but sensitivity becomes 5%, which means that the rate of full cDNA fragments not predicted as full is high (95%). To increase sensitivity of the prediction at high specificity, using similarity of cDNA sequences with other proteins is expected to be effective.
Prediction of fullness of cDNA by using similarity with other proteins
First, we evaluated the accuracy of the fullness prediction by using only similarity. In Figures 6(a), (b), and (c), identity-space of the alignment between an EST and a protein is divided into ten regions. Each figure contains lines representing E-values of <=1, <=0.1, <=0.01, and <=0.00001). The accuracy of specificity or sensitivity of the predictions by similarity in each identity-region is plotted. Specificity of positive prediction, in other words, the rate of sequences truly predicted as full in sequences predicted as full, is shown in Fig. 6(a). Sensitivity of positive prediction, in other words, the rate of sequences predicted as full in truly full sequences, is shown in Fig. 6(b). Sensitivity of negative prediction, in other words, the rate of sequences truly predicted as not full in not-full sequences, is shown in Fig. 6(c). Fig. 6(a) shows that the specificity of positive prediction is an increasing function of identity and is greater than 80% at identities greater than 40%. Specificity varies depending on E threshold at identities of 20%-40%. Fig. 6(b) shows that the sensitivity of positive prediction is an increasing function of identity and is greater than 80% at identities greater than 50%. Sensitivity varies depending on E threshold at identities of 20%-50%. And Fig. 6(c) shows that the sensitivity of negative prediction does not depend on E threshold and is greater than 95%. Figures 6(a) and (b) show that the specificity and the sensitivity of positive prediction are higher at lower E threshold in the identity region of 20%-40%. But if we focus on the number of sequences, not the rate of sequences (specificity and sensitivity), we obtain an opposite trend in terms of E-value. In Figure 6(d), under the same conditions as the other figures, the number of sequences truly predicted as full in each identity region is shown. This figure shows that the number of sequences truly predicted at identities 20%-40% is larger at higher E threshold. Therefore, if false predictions at higher E threshold are removed by any other method, both the number and the rate of true positive sequences can be maximized. To remove these false predictions, the ATGpr score can be used effectively, as explained in the next section.
Prediction of fullness of cDNA by using ATGpr score and similarity with other proteins.
Next, we evaluated the accuracy of the fullness prediction by using both similarity and ATGpr score. For this evaluation, the prediction space, which consists of identity and ATGpr score, is divided into partial regions. Then fullness prediction by similarity and ATGpr is performed and its accuracy in each region is evaluated. Under the conditions that consensus length>=50 bases and E-value<=1, a plain having two axes (identity and ATGpr score) is divided into one hundred regions: (identity (%), ATGpr score) = (0-10, 0-0.1), (0-10, 0.1-0.2), ··· (0-10, 0.9-1), ··· (90-100, 0-0.1), (90-100, 0.1-0.2), ··· (90-100, 0.9-1). The accuracy of the predictions in each region is shown. Specificity of positive prediction, in other words, the rate of sequences truly predicted as full in sequences predicted as full, in identity regions from 20% to 60% is shown in Fig. 7(a). And specificity of positive prediction in identity regions from 60% to 100% is shown in Fig. 7(b). These figures indicate that the specificity of positive prediction (Sp) is greater than 90% at identity of 20%-30% and ATGpr Score is greater than 0.6, Sp is greater than 80% at identity of 30%-40%, and ATGpr Score is greater than 0.3. In the prediction using only similarity, however, Sp is approximately 50% at identity of 20%-40% (as described in the former section). Therefore, by adding ATGpr Score condition to identity condition, Sp increases from 50% to greater than 80% at identity of 20%-40%. This increase is considered to be due to the removal of false predictions by the combination of identity and ATGpr Score. Figures 7(a) and (b) also show that Sp is greater than 80% at identity of 40%-50% and ATGpr Score is greater than 0.2 and that Sp is greater than 80% at identity greater than 50% and ATGpr Score is greater than 0.1. In summary, in any identity region greater than 20%, by combining an appropriate condition for ATGpr Score with the identity condition, Sp will be greater than 80%.
The characteristics of the fullness-prediction accuracy are well represented by the contour lines on the two-dimensional identity-ATGpr score space in Fig. 8. Specificity of positive prediction defined in Fig. 7 is represented by contour lines in Fig. 8(a). Specificity of negative prediction, which is defined as the rate of sequences truly predicted as not-full in sequences predicted as not-full, is represented by the contour lines in Fig. 8(b). Specificity is smoothed as a function of identity and ATGpr score before representing the contour lines. These figures clearly show the region in the two-dimensional space where specificity is greater than 80%. And Fig. 8(a), shows that the specificity of positive prediction is greater than 80% not only in the region where identity is close to 100% or ATGpr score is close to 1.0 but also in the region where both identity and ATGpr score are not so large (that is, identity is around 30%-40% and ATGpr score is around 0.3-0.4). And Fig. 8(b) shows that the specificity of negative prediction is greater than 80% not only in the region where identity is close to 100% or ATGpr score is close to 0.0 but also in the region where identity is not so large and ATGpr score is not so small (that is, identity is around 40%-50% and ATGpr score is around 0.6-0.7. For positive (Fig. 8(a)) and negative prediction (Fig. 8(b)), the region where the specificity is greater than 80% is expanded by combining identity and ATGpr score, that is, this region is bigger than that obtained when only one factor is used for the prediction.
Discussion
In this paper we newly used sequence similarity information for predicting fullness of cDNA fragment sequences. So far the relationship between sequence similarity and protein structure similarity has been intensively studied, and the reliability of structure similarity is represented as a function of identity between sequences [Sander, C., and Schneider, R., 1991]. Our work is similar to this study in a point that relationship with sequence similarity is discussed. The evaluation results in our study also show that the accuracy of fullness prediction is greater than 80% when sequence identity is greater than 40% and the accuracy decreases to 20% when sequence identity decreases to 20%. This finding resembles the fact that the structure similarity is identified when sequence similarity is greater than 30% and is not always identified when sequence similarity is less than 30%. Moreover, we newly showed that the prediction accuracy can be greater than 80% even when sequence identity is from 20% to 40% by combining sequence similarity information with statistical information of sequences (ATGpr score). The combination of sequence similarity and statistical information might be effective in solving the structure prediction problem, in which such an approach has not been used.
In exon prediction of genome sequences, it is known to be effective to combine sequence similarity with proteins and statistical information. [Xu, Y., et al., 1997]. In this case, however, similarity information has to be dealt with carefully when evaluating prediction accuracy; that is, if we predict using all similarity information greater than a threshold, the prediction accuracy of a gene with many similar sequences tends to be too high. This means that when we predict exons for an unknown gene in such a way, the prediction accuracy might be lower than that for a known gene because an unknown gene has a smaller number of similar sequences than that of a known gene (unpublished data). The estimation of prediction accuracy obtained using known data cannot therefore be applied to unknown data; this might be a general problem. It is, therefore, an serious problem to find a way to combine sequence similarity and statistical information and to evaluate it. In the approach to this problem in this study, any information of similarity greater than a threshold was not used, but similarity was divided into several sections and prediction accuracy in each section was determined. Though by using this method we cannot estimate the prediction accuracy for the total unknown genes, we can estimate the prediction accuracy for a given unknown gene. This method of estimating prediction accuracy in each similarity section will be effective for solving other prediction problems (such as exon prediction or protein structure prediction) as well as for predicting fullness of cDNA sequences.
Acknowledgements
We would like to thank Y. Nakamura and T. Nagai of the Helix Research Institute for constructing a system in which we can use informatics tools.
References
Hillier, L., et al., (1996) Generation and analysis of 280,000 human expressed sequence tags. Genome Res., 6, 807-828.
Maruyama, K. and Sugano, S. (1994) Oligo-capping: a simple method to replace the cap structure of eukaryotic mRNAs with oligoribonucleotides. Gene, 138, 171-174.
Salamov, A. A., Nishikawa, T., and Swindells, M. B. (1998) Assessing Protein Coding Region Integrity in cDNA Sequencing Projects. Bioinformatics, 14, 384-390.
Sander, C., and Schneider, R., (1991), Database of homology-derived protein structures and the structural meaning of sequence alignment, Proteins Structure Function and Genetics, 9, 56-68.
Schuler G. D. (1997) Pieces of the puzzle: expressed sequence tags and the catalog of human genes. J Mol Med, 75, 694-698.
Xu, Y., Mural, R. J., and Uberbacher, E. C., (1997) Inferring Gene Structures in Genomeic Sequences Using Pattern Recognition and Expressed Sequence Tags, Proceedings of fifth International Conference on Intelligent Systems for Molecular Biology, 344-353.
Figure captions
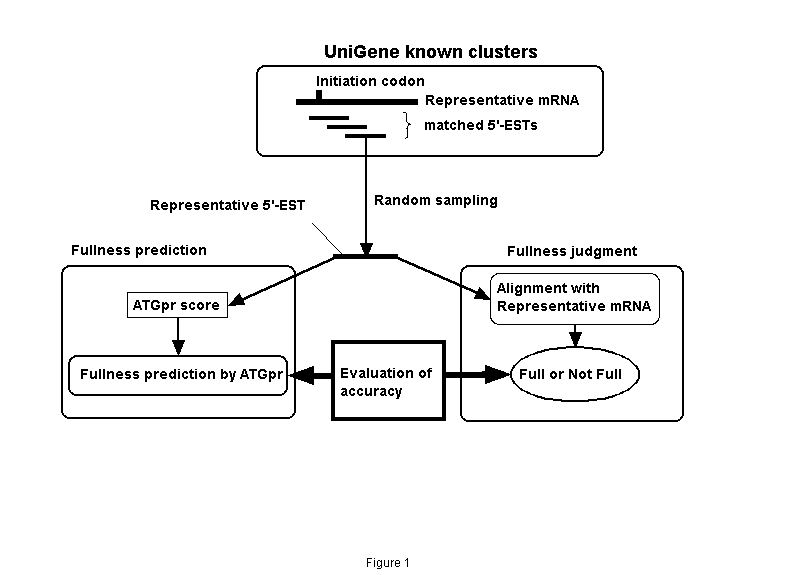
Figure 1. Evaluating the accuracy of fullness prediction of cDNA sequences using UniGene. Prediction is by ATGpr.
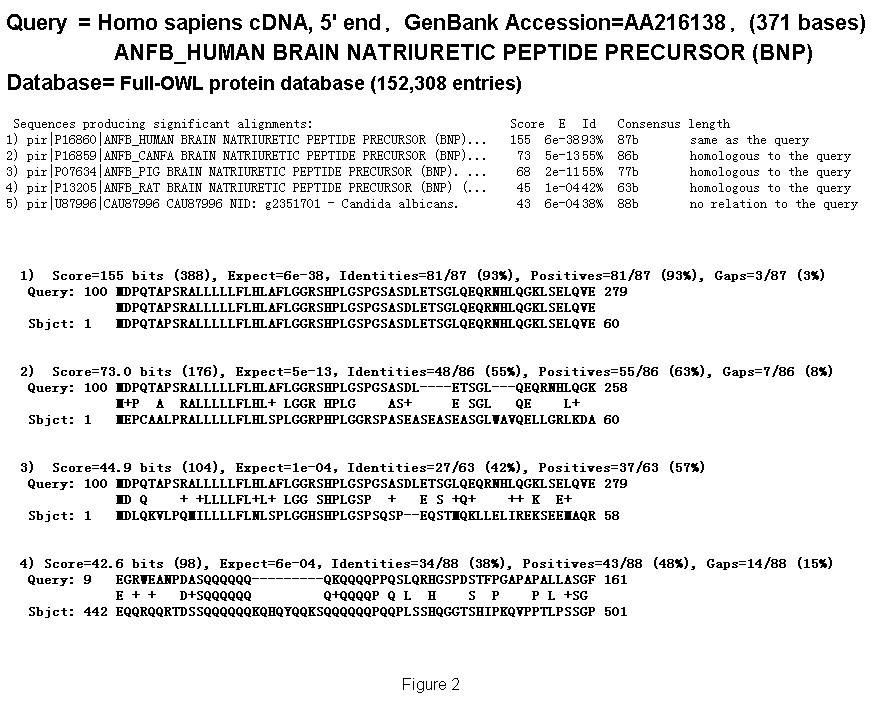
Figure 2. Coincidences of initiation codons between proteins at various similarity levels (Examples of BLASTX alignments).
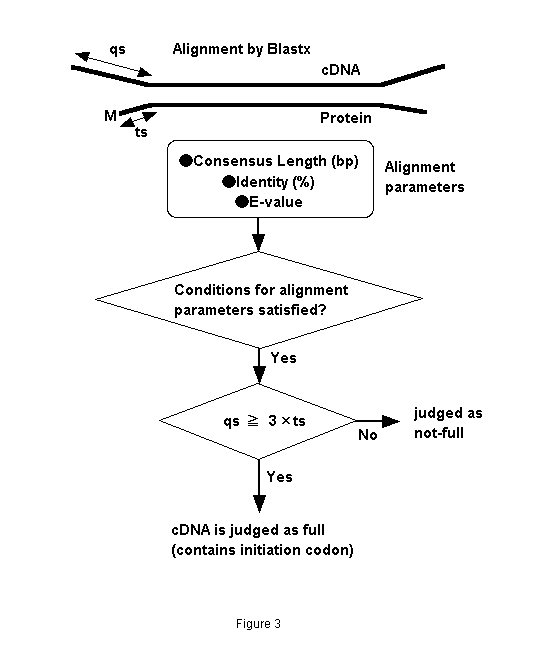
Figure 3. Flow chart of fullness prediction by similarity with other proteins.
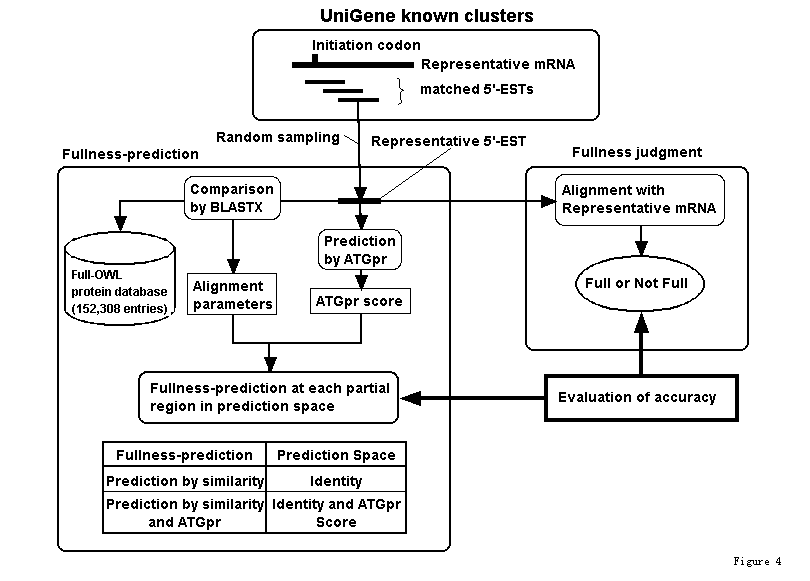
Figure 4. Evaluating the accuracy of fullness prediction by a combination of similarity with other proteins and ATGpr using UniGene.
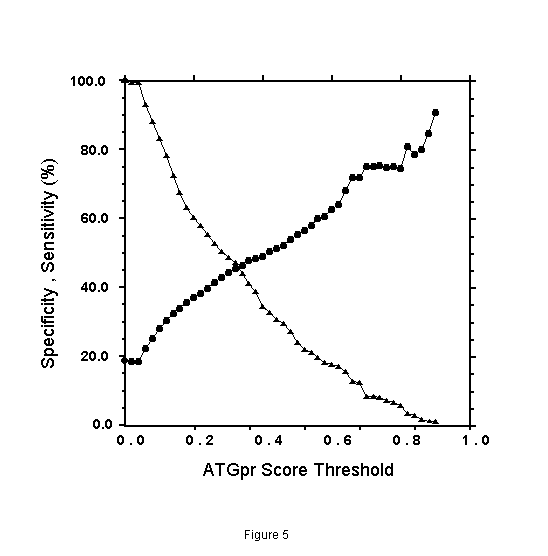
Figure 5. Specificity and sensitivity of the prediction of fullness of cDNA by ATGpr as a function of ATGpr score threshold. Specificity ( ), Sensitivity (
 )
)
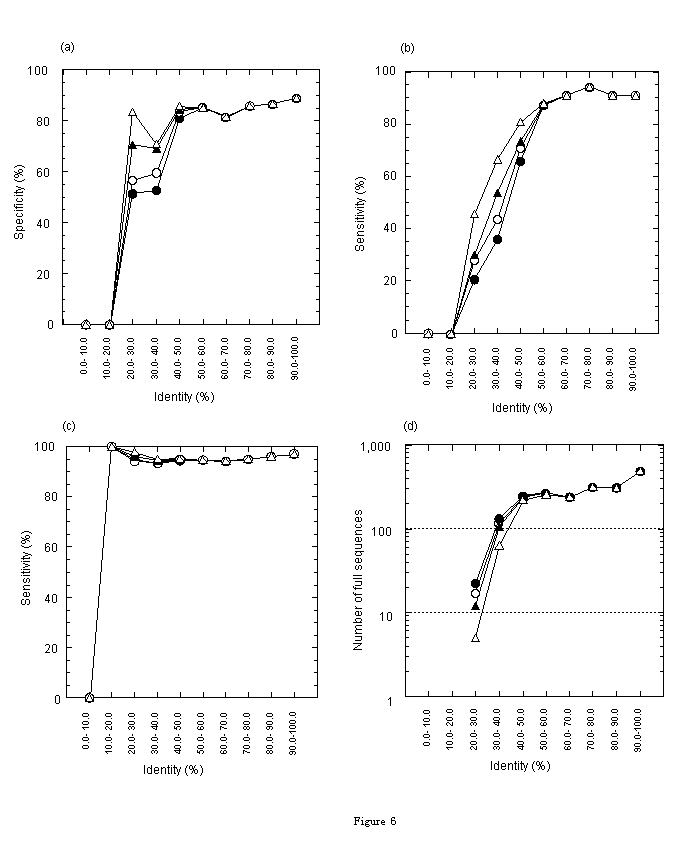
Figure 6. Prediction accuracy in each identity-region. [Conditions: consensus length>=50 bases; E-values<=1 (), <=0.1 ( ), <=0.01 (), and <=0.00001 (
 )]. Identity is divided into ten regions, 0-10, 10-20, ···, 90%-100%. (a) Specificity of positive prediction (the rate of sequences truly predicted as full in sequences predicted as full). (b) Sensitivity of positive prediction (the rate of sequences predicted as full in truly full sequences). (c) Sensitivity of negative prediction (the rate of sequences truly predicted as not-full in not-full sequences). (d) Number of sequences truly predicted as full.
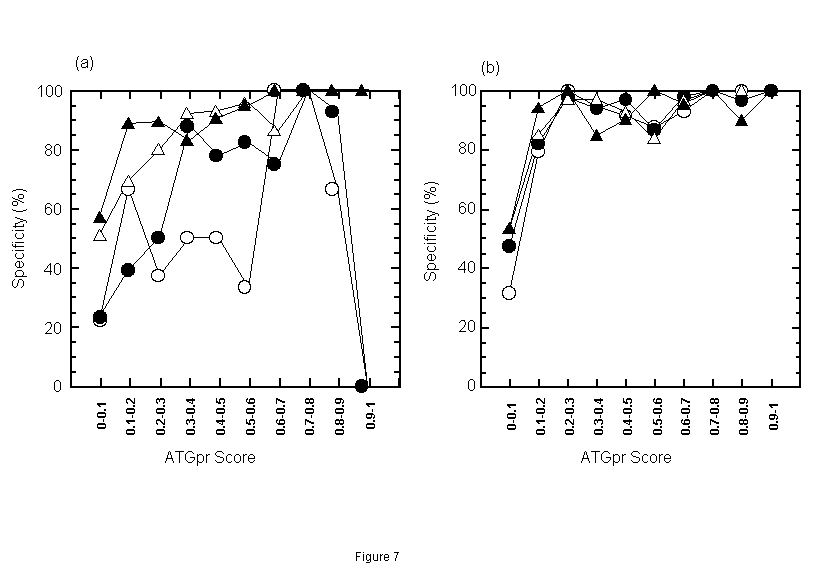
Figure 7. Specificity of positive prediction (rate of sequences truly predicted as full in sequences predicted as full) in each identity-ATGpr score region when consensus length>=50 bases and E-value<=1. [The prediction space having two axes, identity and ATGpr score is divided into one hundred regions, (identity, ATGpr score) = (0-10, 0-0.1), (0-10, 0.1-0.2), ···(0-10, 0.9-1), ···(90-100, 0-0.1), (90-100, 0.1-0.2), ···(90-100, 0.9-1).] Fig. 7(a): Specificity of positive prediction is plotted in identity regions from 20% to 60% (20%-30% (), 30%-40% (), 40%-50% (), 50%-60% ()). Fig. 7(b): Specificity of positive prediction at identity regions from 60% to 100 % (60%-70% (), 70%-80% (), 80%-90% (), 90%-100% ()).
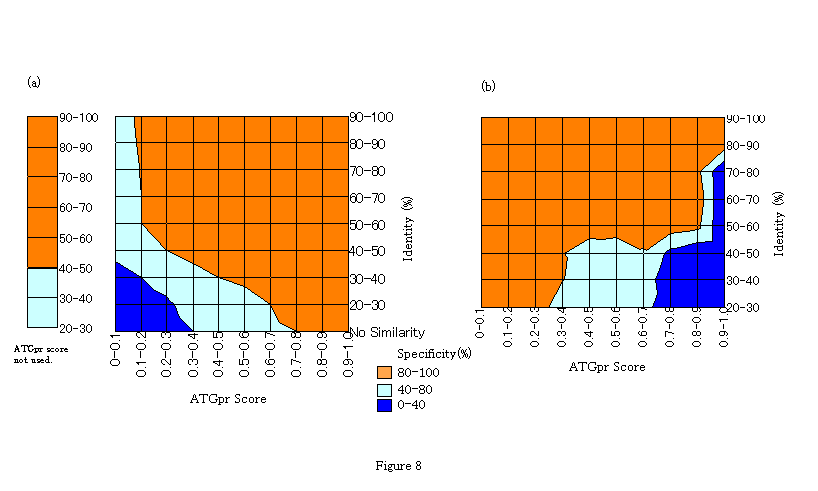
Figure 8. Accuracy representation of fullness prediction by contour lines on two-dimensional identity-ATGpr score space. (a) Specificity of positive prediction defined in Figure 7. (b) Specificity of negative prediction defined as the rate of sequences truly predicted as not-full in sequences predicted as not-full. For both figures the regions are clessified by colors. Red region: Specificity >=80%, White region: Specificity >=40% and Specificity <80%, Blue region: Specificity <40%.